Five Ways to See Your Sound: Meet Lumituner's Visualizers
A tuner usually gives you one answer: the note. That’s useful, but it leaves a lot of the signal hidden. The attack, noise floor, harmonic balance, sustain, and level are all still there, shaping what the tuner hears and what you hear.
Lumituner now has five live visualizers, each built to show a different side of that signal. Open the Visualizer control at tune.lumituner.com and switch views while you play. Signal EQ, Waveform, Spectrogram, Levels, and Kaleido all require Pro. The standard strobe tuner remains free. See Pro pricing.
Signal EQ: where the energy lives
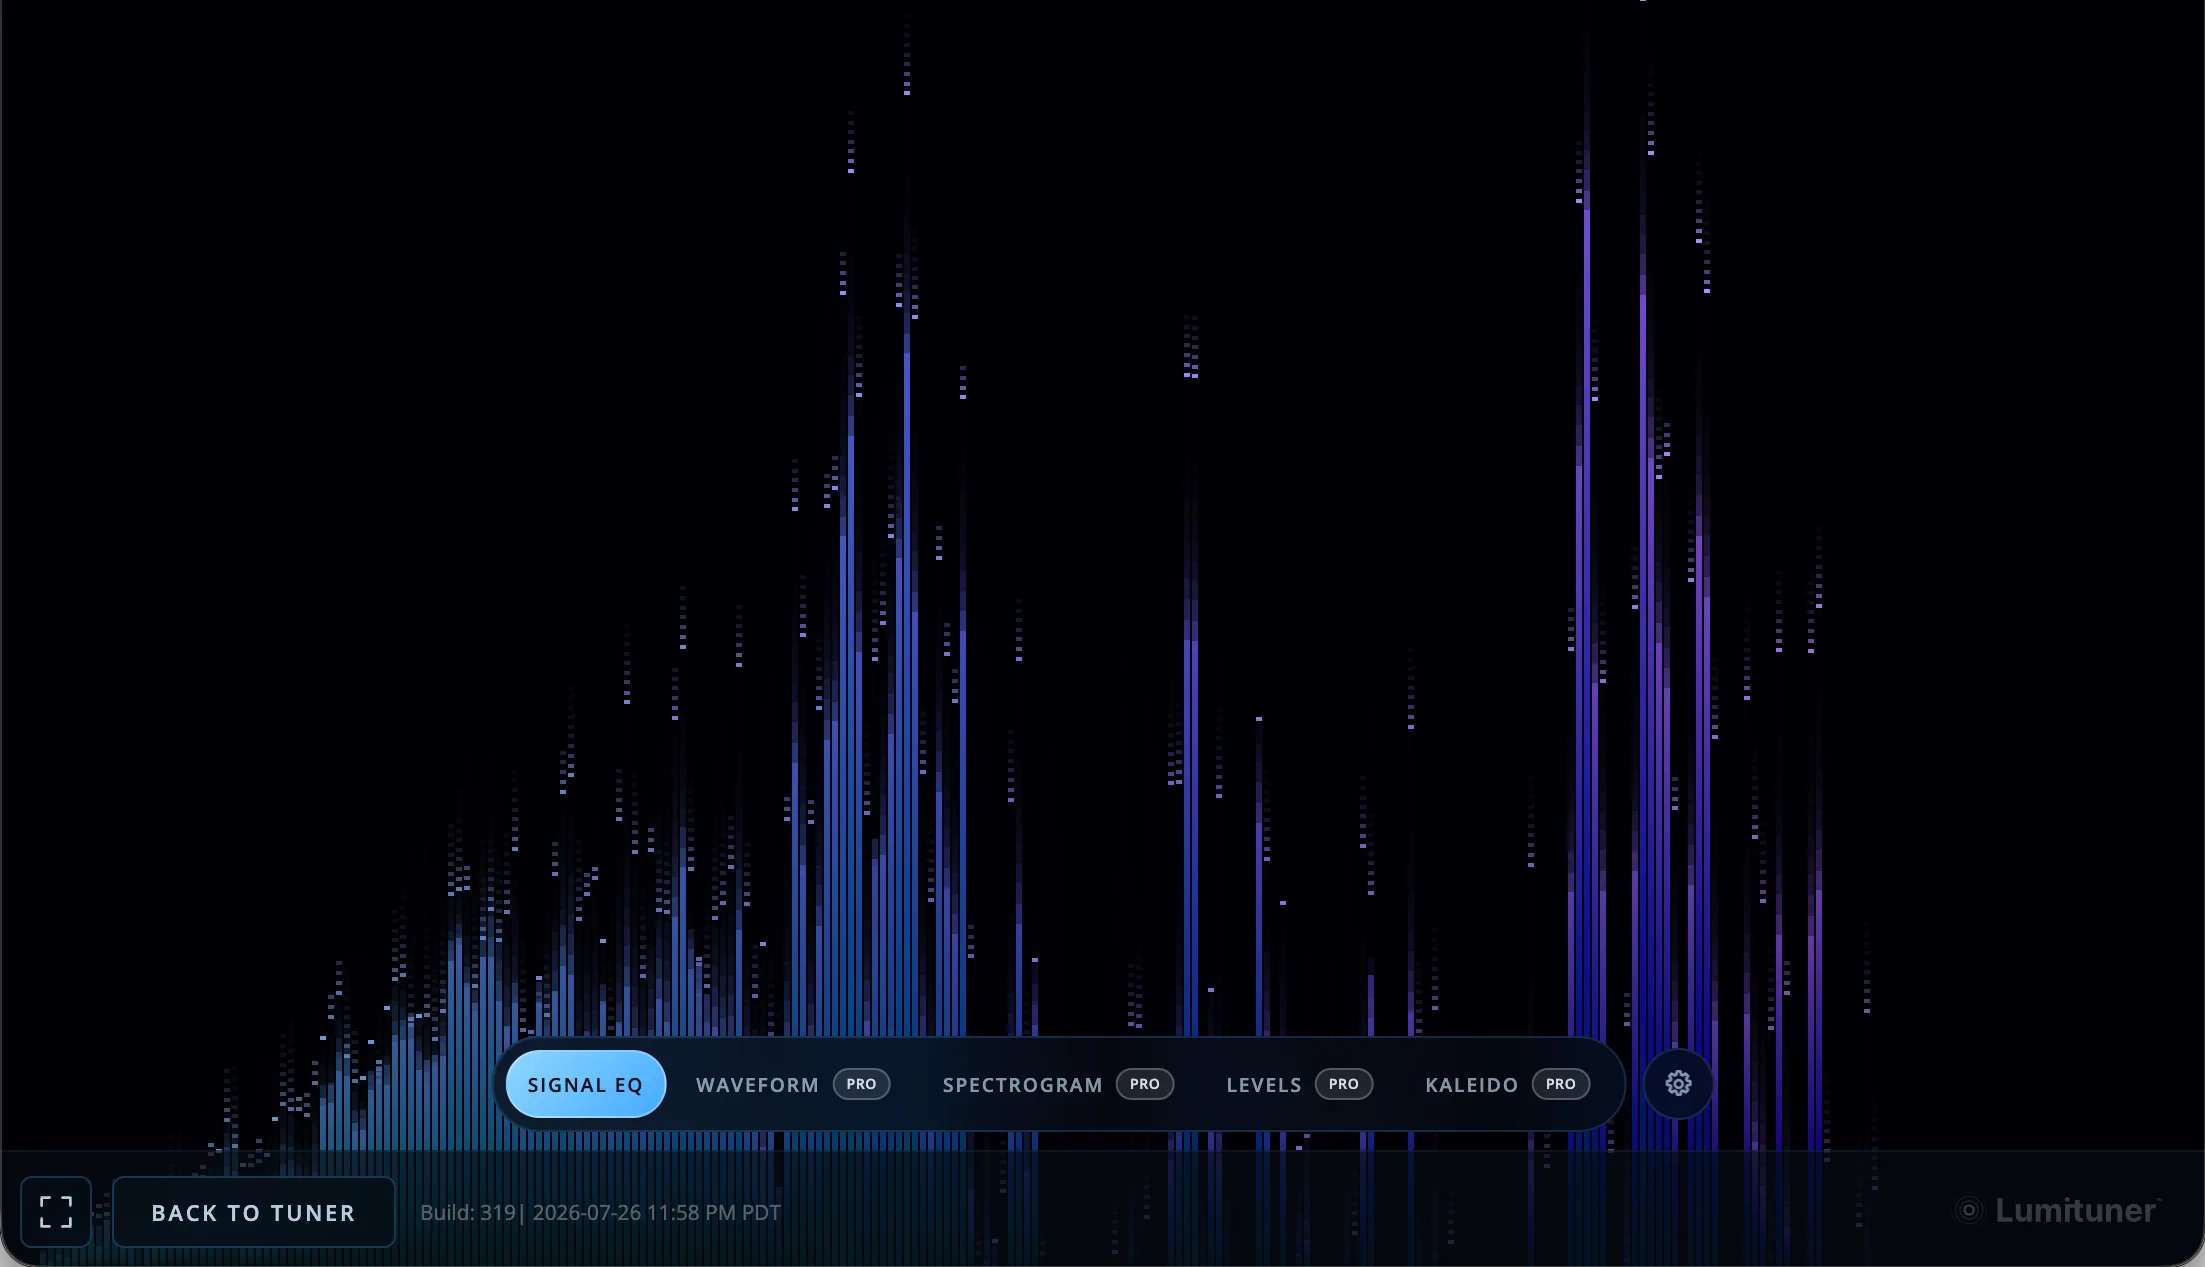
Signal EQ spreads the incoming sound across responsive frequency bars. It is the fastest way to see whether a note has a strong fundamental, a bright stack of upper harmonics, or low-frequency noise competing with the pitch.
Try it while moving your picking hand from the bridge toward the neck. The note can stay the same while its harmonic balance changes dramatically. Signal EQ makes that change visible.
Waveform: how the sound moves
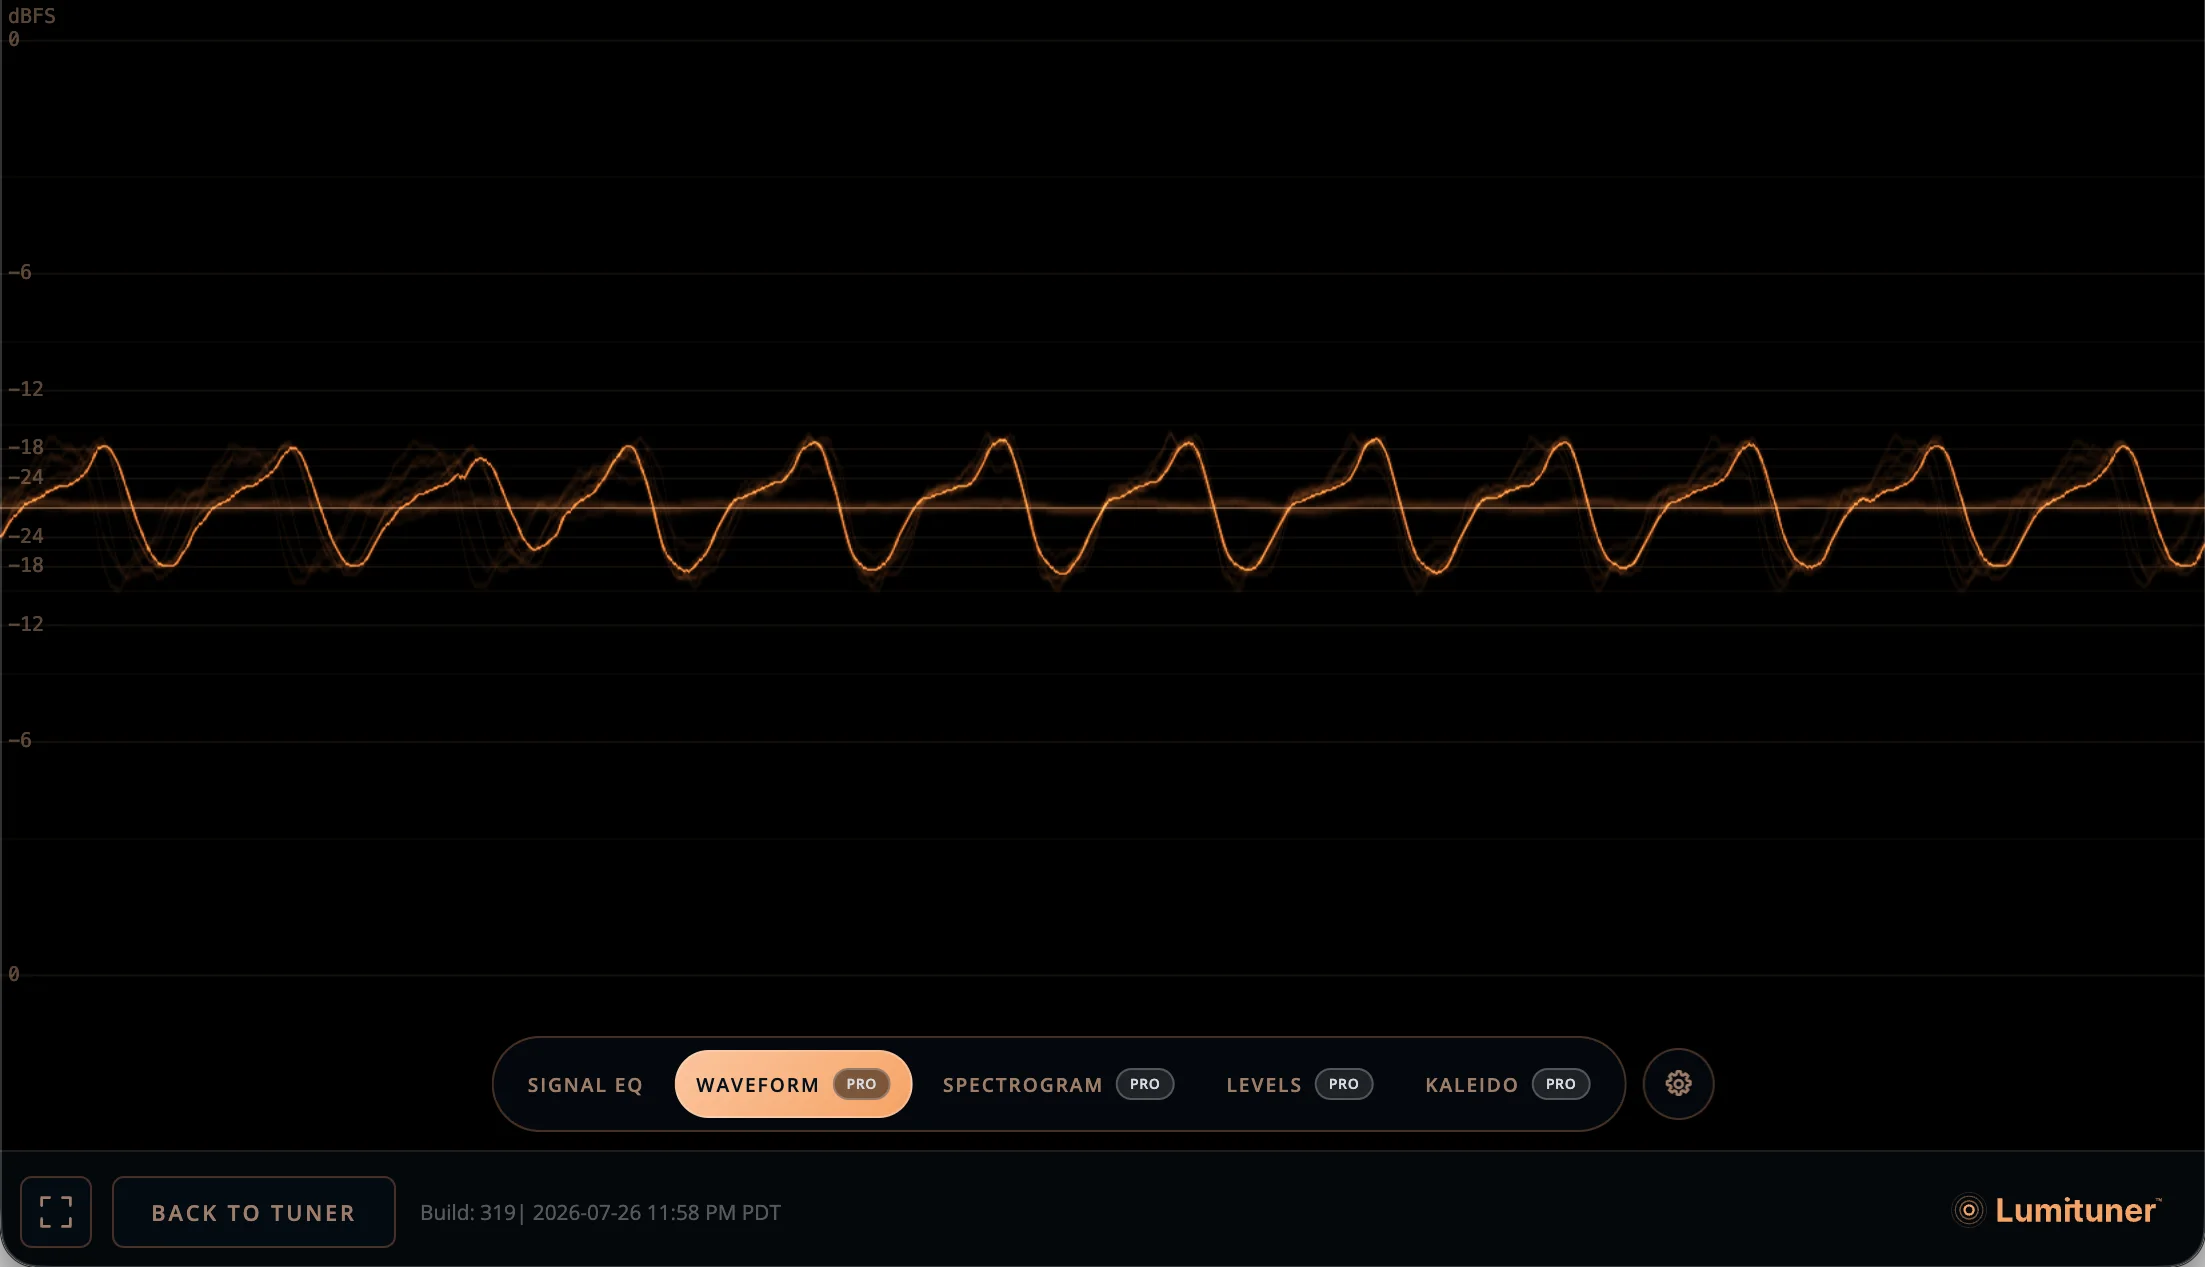
Waveform shows the shape and consistency of the incoming audio over time. A clean, sustained note settles differently from a hard transient, a buzzing string, or a signal with uneven level.
This view is especially useful when you are working on attack consistency. Play the same note several times and watch whether each strike begins at a similar level and decays at a similar rate.
Spectrogram: pitch through time
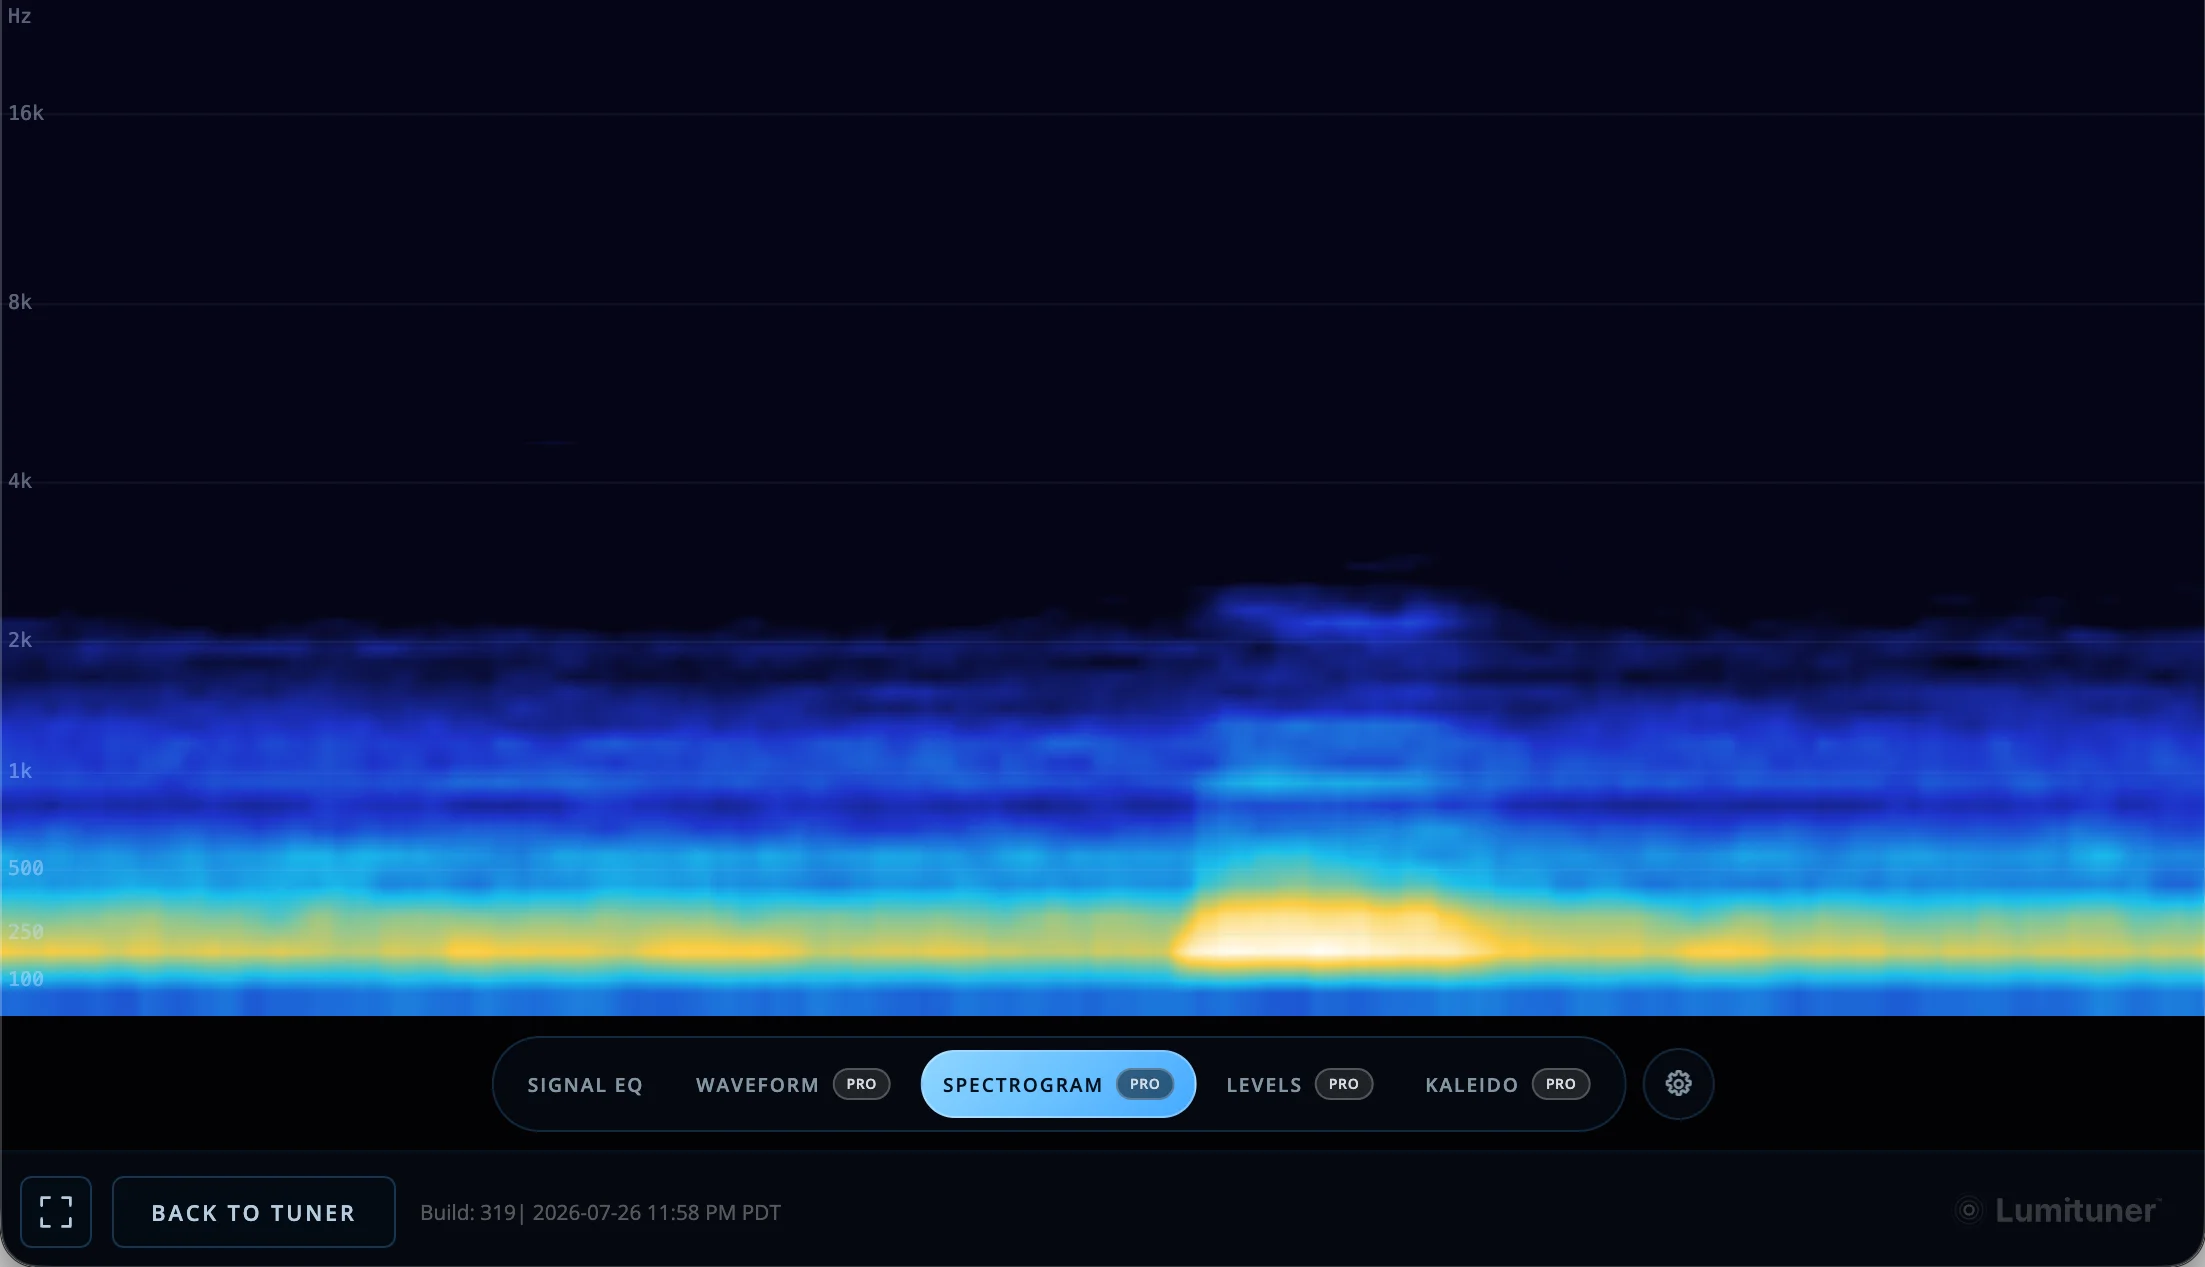
Spectrogram turns frequency into a moving history. Strong pitch energy forms visible bands, while harmonics appear above the fundamental. Because the display keeps moving, you can see how a note develops after the initial attack instead of looking at a single instant.
Use it to compare open and fretted notes, watch overtones fade, or spot energy that appears only during the attack.
Levels: gain without guessing
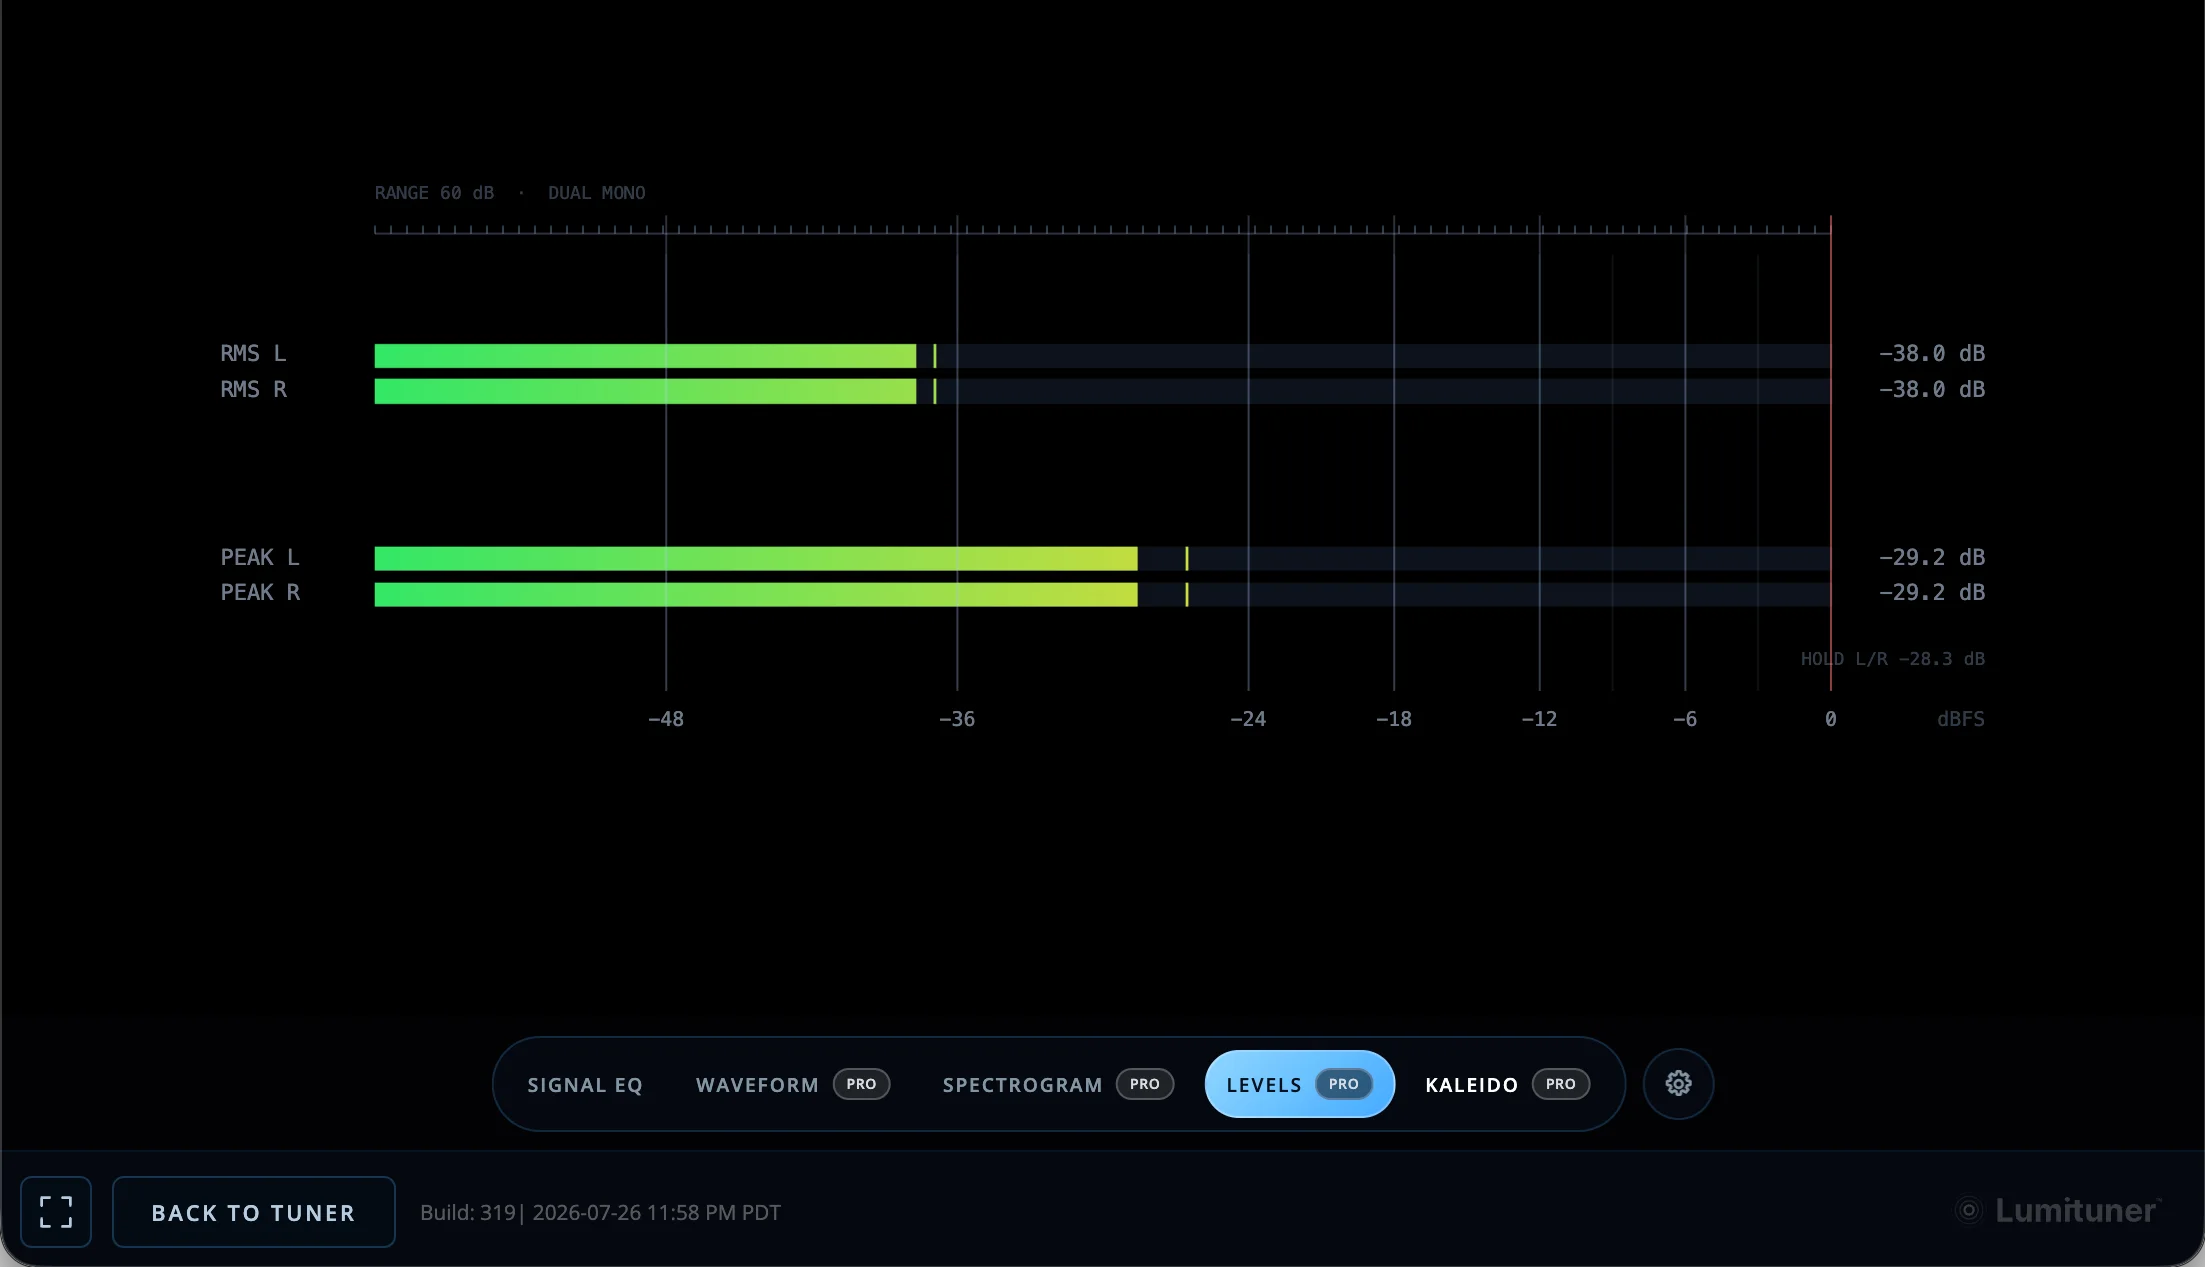
Levels gives you a precise meter for RMS, peak, and held levels. It answers a simpler but important question: is the tuner receiving a healthy signal?
Too little level can make pitch detection hesitant. Too much can clip the microphone or interface input. Levels helps you place the signal between those extremes before changing sensitivity or threshold settings.
Kaleido: make the signal perform
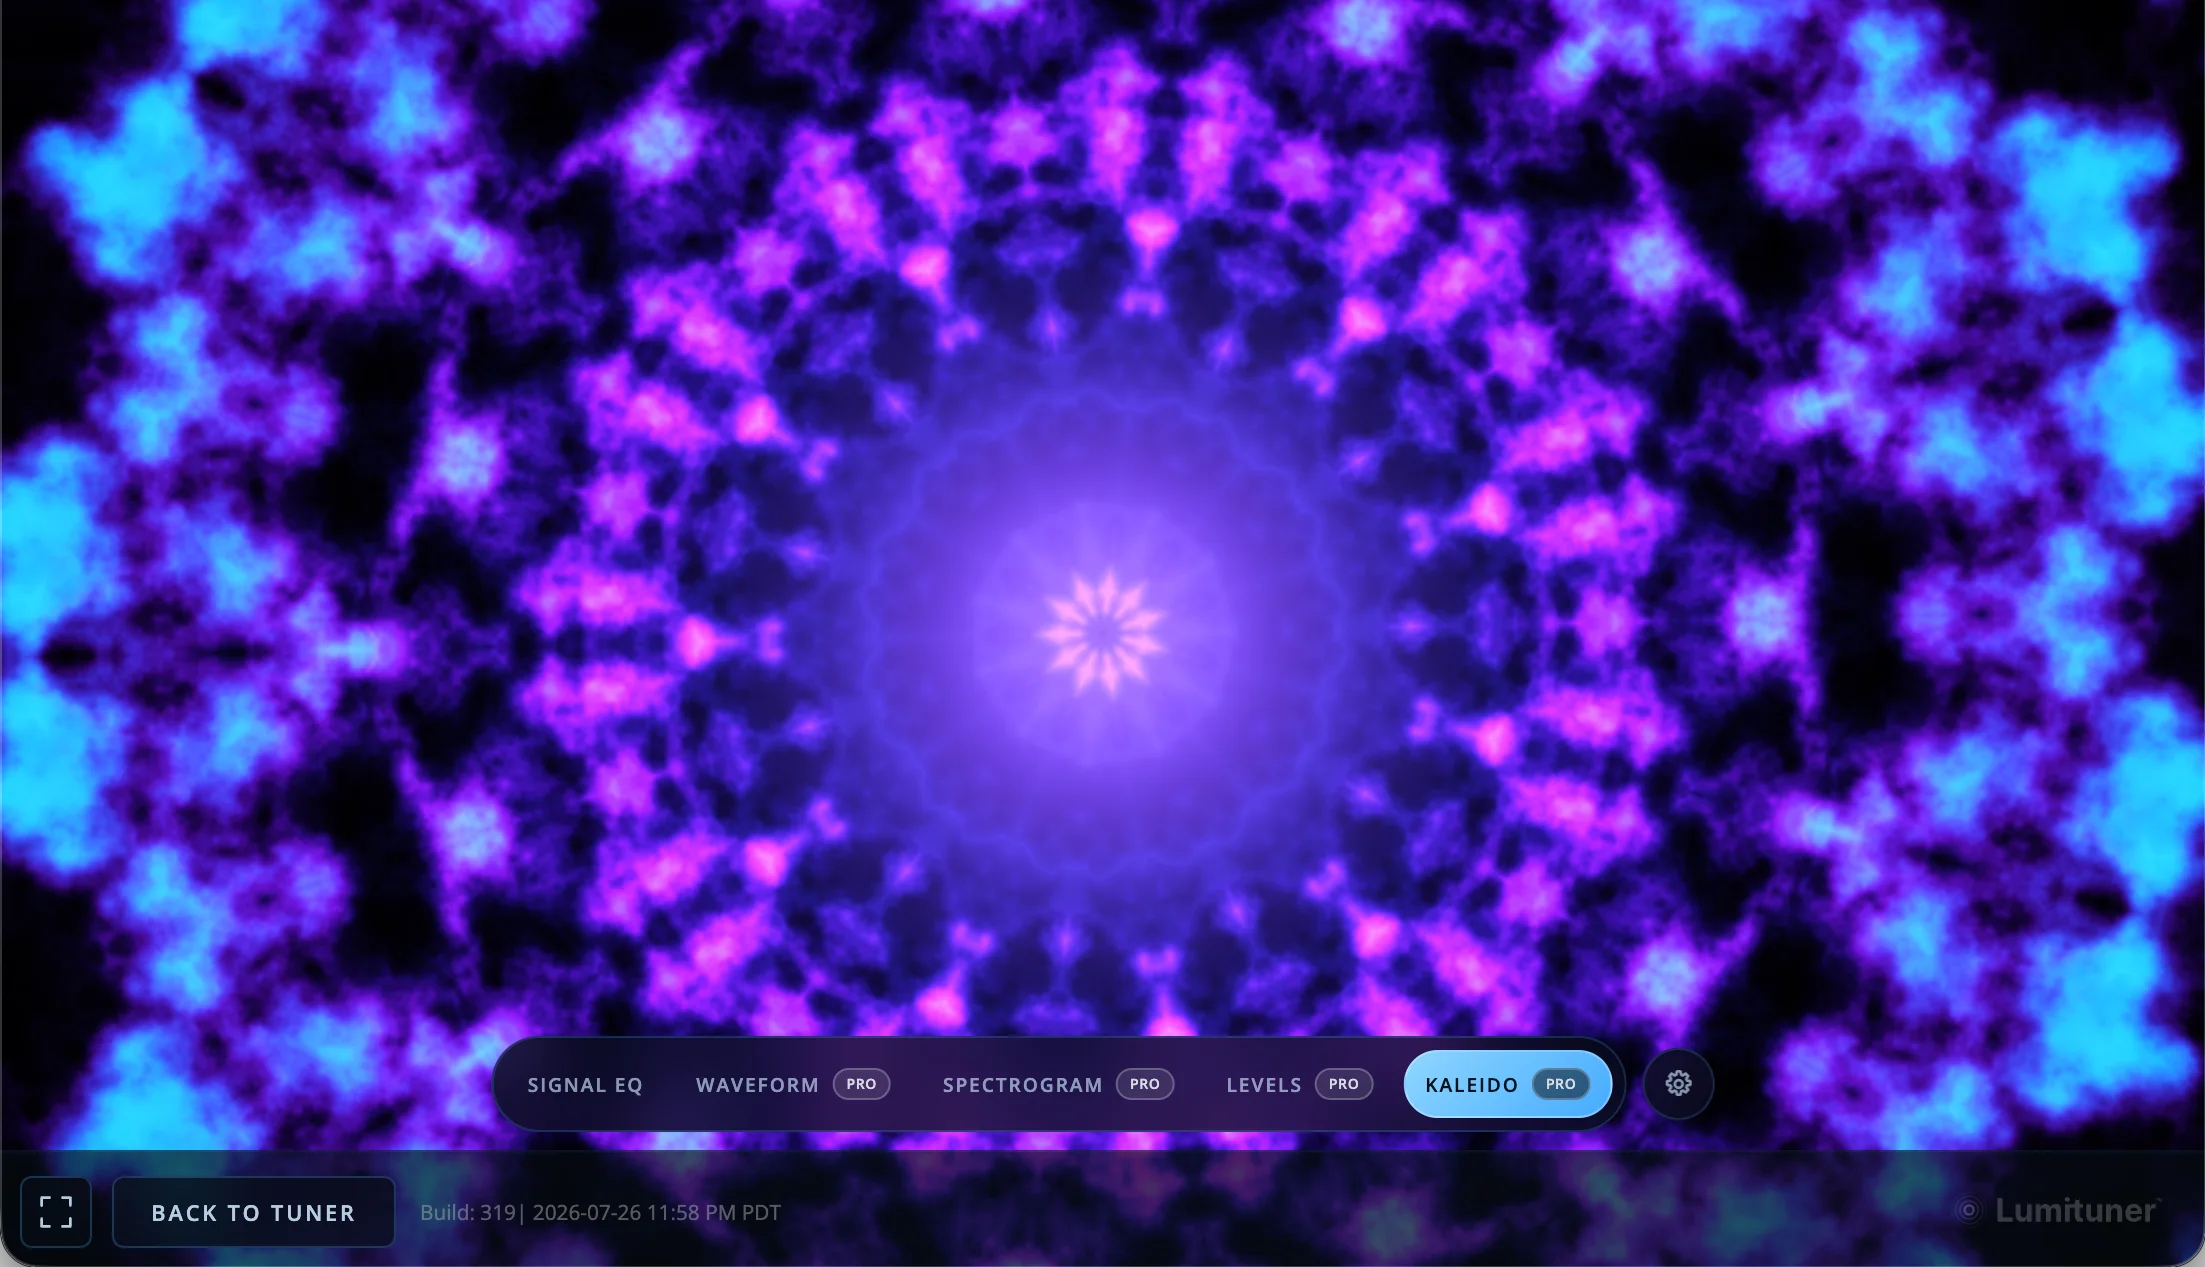
Kaleido maps the live signal into a radial pattern that reacts to pitch, level, and harmonic movement. It is less diagnostic than the other views and much more about seeing the sound come alive.
Hold a steady note, add vibrato, play a chord, then let it decay. The geometry shifts with each change, making Kaleido a good full-screen view when you want the tuner to feel like part of the performance.
Pick the view that answers the question
There is no single best visualizer:
- Use Signal EQ for harmonic balance.
- Use Waveform for attack and consistency.
- Use Spectrogram for pitch and overtones across time.
- Use Levels for input gain and dynamics.
- Use Kaleido when you want the sound to become the visual.
You can preview all five on the Lumituner homepage, then open the online tuner and see what your instrument is actually sending into the microphone.
